There are thousands of students and educators working incredibly hard in New Orleans public schools each day. They are solving big problems. They are achieving victories both great and small. They are undeterred in the face of difficulty. When we talk about schools, we are talking about people. This work is complex, nuanced, and hard.
In Louisiana, the work of schools and their people are measured, in part, by School Performance Scores and corresponding letter grades. These scores and grades were released around a month ago, and it is important to take stock of where we are now and where we must go. We care about these numbers because we care about the people behind them, and because, most of all, improvement in these scores means increased opportunities for our children.
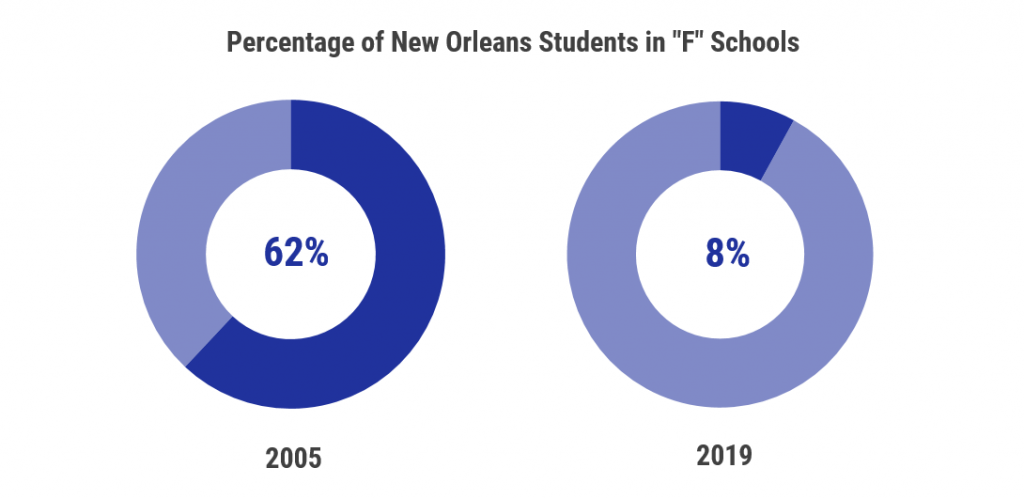
In Louisiana today, school letter grades take into account factors like standardized test performance, students’ year-over-year growth, and graduation rate, among others. New Orleans has seen significant progress overall in the past fourteen years. In 2005, 62% of New Orleans public school students were in schools that earned an “F.” Now, only 8% are. This is the same percentage as last year. That drop from 62% to 8% is enormous, and has a real impact on the lives of our children.
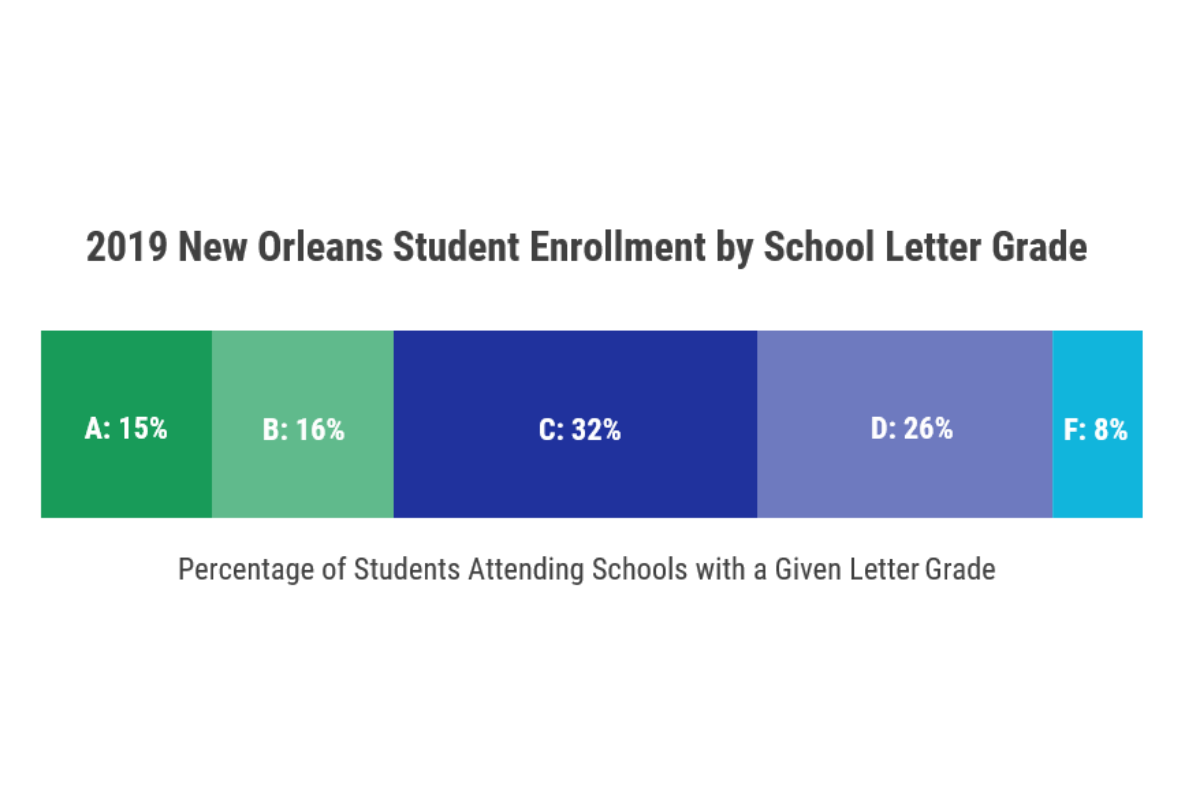
But 8% still represents too many children in “F” schools. It is clear we need more progress, especially when we zoom out one more letter grade: 26% of students in New Orleans are in “D” rated schools, bringing us to a total of 34% of students attending schools in our city that are either “D” or “F” rated, compared to 25% last year.* Approximately half of our “D” schools are within three School Performance Score (SPS) points of being “C” schools—but this is not high enough. And though most New Orleans schools maintained their letter grade between 2018 and 2019, the percentage of “D” and “F” schools does represent an increase from last year. Looking across our system as a whole, 32% of our students now attend schools that are “C” rated, and 31% are in “A” and “B” schools.
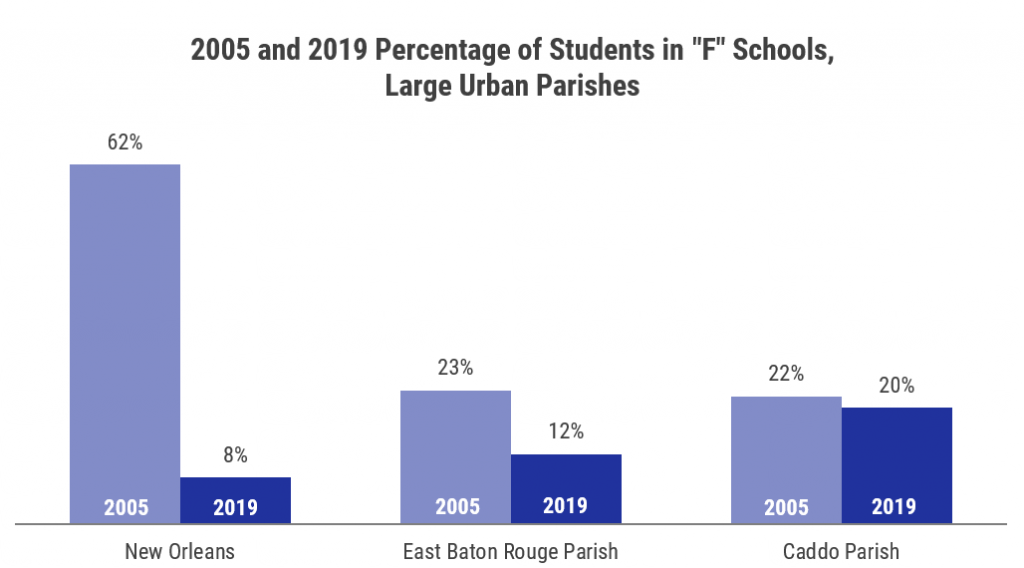
We want to take a nuanced look at the context of these numbers within Louisiana. New Orleans has a smaller percentage of students in “D” and “F” schools than two other large urban parishes, Caddo Parish and East Baton Rouge Parish, even as both of those parishes have a smaller percentage of students designated as “economically disadvantaged” by the state. This marks striking improvement since 2005, when the percentage of New Orleans students in “F” schools alone was more than double that of those districts.
That said, we are deeply concerned about the 34% of children in “D” or “F” schools, and the increased number of students in “D” rated schools.
We believe there are two main factors that have led to this increase: our state academic standards have grown more rigorous, and 2018-19 was the majority of our schools’ first full year using new high-quality curriculum designed to meet those standards. As schools and students adjust to the new curriculum and those higher standards, we expect to see improvement.

Louisiana’s current journey towards higher academic expectations began a decade ago, but the most significant step occurred in 2016 when the new Louisiana Student Standards and corresponding new LEAP assessments were implemented. Raising the academic standards that our children must meet was a critical, positive step because data showed that colleges and workplaces in Louisiana and nationwide require more of our students than we were preparing them for. It is also a matter of equity – many research studies have shown both correlation and causation between higher expectations from teachers and higher student performance.
Before the standards and assessments were implemented, the Louisiana Department of Education had begun supporting schools with the transition in 2014 by reviewing hundreds of available curricula and designating the highest-quality options that aligned with the new standards as “Tier 1,” and recommending their adoption. Many parishes across the state began adopting Tier 1 curriculum, and by 2017, over 70% were at least in part utilizing Tier 1.
Most New Orleans schools did not adopt right away, in part because many had made progress without that Tier 1 curriculum during a period of the shift when school ratings were being graded on a curve, and they did not initially see the need to make a change. But eventually, in the 2018-19 school year, the majority of New Orleans public schools adopted Tier 1 curriculum in both ELA and math. It will take some time for teachers to truly internalize the new content and methods, and for students to adjust in turn.
Change does not happen right away. Other parishes across the state adopted Tier 1 curriculum earlier than New Orleans, and their leaders spoke to us about the process of that change. Carey Laviolette, Superintendent of Iberia Parish School District, noted that the process of curriculum implementation is long, but fruitful. She said, “Go through the struggles and it will pay off. That’s what I would say to anyone wanting to start. We have evolved over time.”
Our State Superintendent of Education, John White, has pointed out that the switch to more rigorous standards and assessments, and other aspects of the state’s process of raising the bar, has an impact on School Performance Scores and letter grades. He has said that “as the state transitions gradually to higher expectations, it will become more challenging for schools and districts to maintain high ratings.” Implementing new curriculum is a part of this process, and results do not happen overnight.
Even outside of Louisiana, this is the case. At a recent education research conference, Baltimore City Public Schools CEO Sonja Santelises described the adoption of a high-quality curriculum as “the first half of Chapter One.”
We must remember that teachers are the key to all of this. They are the ones putting curriculum in place and they are the ones working with and caring for our children each day. In addition to focusing on high-quality materials and support, we must focus on them. We need more excellent teachers in our city, and we need those who are already here to stay. They need the continued support, pay, and professional development they deserve.
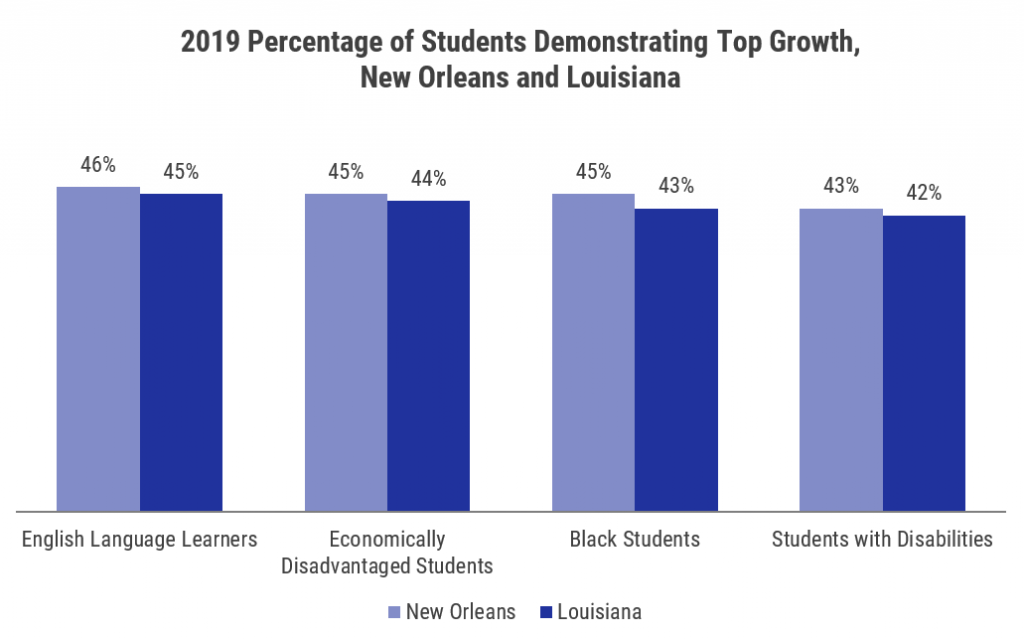
This work is complex, nuanced, and hard, but we are hopeful. When we think about all the pieces of our system, there is so much to be proud of. Our students and teachers are showing striking improvement. New Orleans has a higher percentage of students who demonstrate “top growth”—“A”-level year-over-year progress— than the state at large, and than most other large urban parishes, for all historically disadvantaged subgroups identified by the state. Our Black students’ average ACT composite score is higher than both the state and national averages for Black students. Our improvement over time has vastly outpaced other urban parishes, with the percentage of students in “F” schools dropping from more than twice that of our peers to a similar or smaller percentage.
As we acknowledge the tremendous progress over the last fourteen years, we must continue to strive for better; we work for the day when no child is in a “D” or “F” rated school. We will get there. High-quality curriculum implementation and great teacher and school leader talent will help us do so. While we will continue to innovate and adjust as needed, we must stay the course—our unique model has facilitated unprecedented improvement. Our children are doing such work each day, with creativity, focus, and a fierce determination to grow. When we need inspiration, we can look straight to them. We must all continue to move forward together.
*At NSNO, we look at letter grade distribution using the percentage of our city’s children that attend schools in each letter grade, rather than the number of schools in each letter grade category. We believe this more accurately represents the impact of school ratings on our city’s students, as our schools’ size varies from new, growing schools with 50 students to K-12 schools with almost 2,000 students. Data points cited here are based on October 1 enrollment counts from the current school year. We include alternative schools in these calculations since almost 1,000 students attend such schools, and do not include schools that closed at the end of the 2018-19 school year since students are no longer attending them.
|
|